The world is extremely complex. Mathematics have tried to analyse it with its tools. But the complexity of mathematics, and the difficulty of making calculations have been an obstacle to the use of mathematics in analyzing and understanding the world. Yet, computer science now enables these calculations to be done at very high speed. As computers develop, there is an amazing interest in developing more complexed mathematical models, with the hope that computer chips may be powerful enough to deal with the complexity.
Quite often, when faced with a decision to make, even in companies, we draw a pros and cons list. Then we try to balance the importances of each entry of the list. One way of doing it is that saying that what seems twice as important should have a weight twice as high. I’m going to go ahead and say that this is an awful way of doing things. Just imagine you had to make a decision for the company between two alternatives. One of them costs 2,000,000$, while the other costs 1,000,000$. But 99% of the company’s employees prefers the former alternative, against 1% for the latter one. Now, one might say that the employees’ opinions are 100 times more important than the cost. But then, if you put a weight 100 times more important to the employees’ opinions, then the first option would have a value of -2,000,000 + 99×100 = -1,990,100, while the second option’s value would be -1,000,000 + 1×100 = -999,900, thus making the second option better. Obviously, the method I have described here was done in a very very bad way. The point here is to catch your attention on the importance of using a meaningful multi-criteria decision analysis.
Introduction to Multi-Criteria
One approach to model complex objects is by defining it through its properties. In multi-criteria decision analysis, properties are called criteria. For a given object, each criterion takes a value, called level. Thus, an object is defined by the levels of criteria.
Sure. Imagine you were looking for an apartment in Montreal. You’d need to compare offers on some website, like craigslist or kijiji. These websites give a list of apartments. Each apartment remains quite an abstract object for you though. How will you detect the ones you prefer?
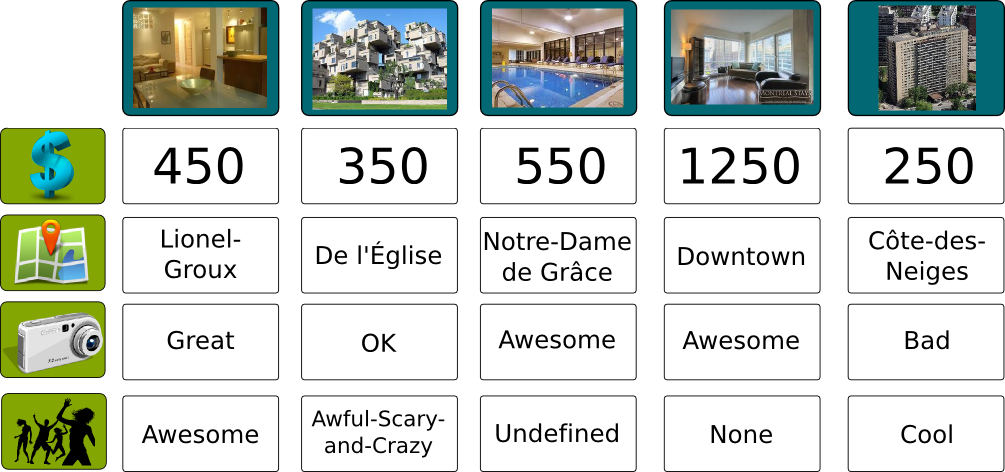
Well, you are pretty much defining the list of criteria. Price, location, pictures, roommates… these are the criteria. Now, each criterion for each apartment takes a level. The price is a number in dollars, the location is a GPS coordinate, the pictures can be graded looks awesome, looks great, looks ok, looks bad and looks awful. The roommates can be described by their numbers, and how much of fit you think you’ll be with them. It’s also possible that there is no description of them, in which case the level of the roommates could be undefined roommates. Undefined is definitely worse than awesome roommates, but it’s also better than awful-scary-and-crazy roommates.
One crucial thing is to choose the right list of criteria, so that, ultimately, your multi-criteria analysis is relevant. When judging the overall quality of an apartment you should not consider the color of mugs as a criterion (unless, of course, if you’re really into pink mugs!). Note that empirical studies have shown that considering more than 13 criteria is useless, at least for the common multi-criteria analyses.
The following figure displays the description of 5 apartments by the 4 criteria we have mentioned:
Now, our goal is to convert all the criterion levels into a single number that will express the overall value of an apartment. This conversion will be the transition between the objective description of the apartment into the subjective definition of its quality. If we manage to do that, we’ll be grading apartments efficiently. Ultimately, it will be much easier to find our favorite apartments.
In this example with 5 choices, you probably can. Yet, in the end of August, tens of thousands of students arrive in Montreal, and there are thousands if not tens of thousands of choices. There is no way, you can do a reasoning for each one of them. That’s why using a computer to help to sort the apartments out can be quite useful!
The simplest way is by defining the overall value of an apartment as a weighted sum of values of levels of the apartment.
Oops, I have merged two different concepts in a single phrase… First, let’s associate each of the possible levels of a criterion with a value (also known as utility) which is higher for preferred levels. For instance, a price of 1,250$ per month is not appreciated, thus the value associated to this price is low, say 0.1. On the opposite the value of a price of 350$ is high, say 0.8. A value of 250$ is even better, but not that much better, as we can afford for both places. Its value could be 0.9.
It’s very important to notice the difference between the level of a criterion and its value! The value of a price of 10,000$ is probably almost the same as the value of a price of 100,000$, since, in both cases, we cannot afford the apartment. But the levels, that is, 10,000$ and 100,000$, are very different.
That’s the first of the two difficulties with multi-criteria analysis.
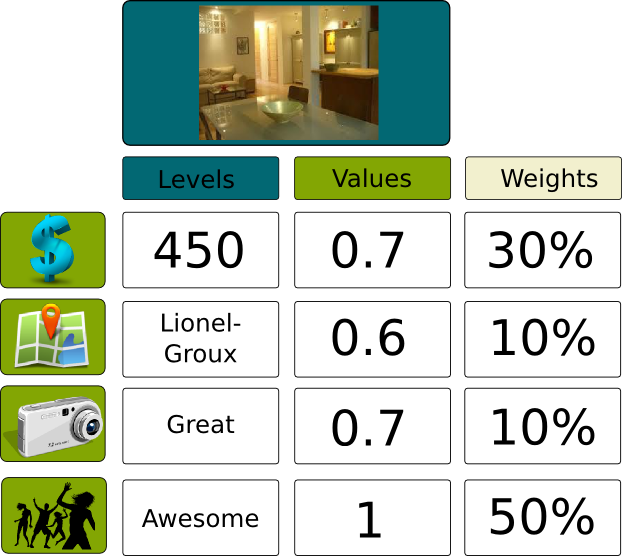
Well, now that we have associated levels of criteria with numbers, for each apartment, we have a list of values that describe the quality of the apartment according to each criterion. For instance, for the first apartment, the values may be 0.7 for the price, 0.6 for the location, 0.8 for the pictures and 1 for the roommates. We need to aggregate all these values into one value. The way we do that is by doing a weighted sum.
To each of the criterion we will associate another number that corresponds to the importance of the criterion. Location and pictures may not be a big deal for me so they may have a weight of 10% each, while price is important and roommates are even more important, with weights of 30% and 50% respectively. Now that we have all those numbers, we can calculate the overall quality of the apartment with the weighted sum of values, that is, the sum of the values multiplied by the corresponding weights:
In this case, the overall value of the apartment is (.7x.3) + (.6x.1) + (.7x.1) + (1x.5) = .84.
That’s the second difficulty. Especially since the values for different criteria may not have the same scales a priori. For instance, values of prices may all be close to 1, except for very expensive which I won’t be looking into anyways. Thus, from an apartment to another apartment which is of interest for me, the values of prices almost don’t differ. Yet, the weight of prices should depend on how the values of prices vary. The case where they vary only a little bit and the weight is high is equivalent to the case where they vary a lot and the weight is low. So choosing the right percentage seems very very difficult.
There are different ways, including ELECTRE, PROMETHEE and conjoint analysis. The one I’m going to present here is MACBETH, because I think it’s a very appropriate way. Also, I must admit that I’m not that familiar with most of other methods. If you know the other methods, you should write about them!
Determining Values
The idea for determining values for levels of a criterion is to manage to put them all on a scale. In this setting, a good thing to do is to start by finding the best and worst level. Then, all other levels should be placed somewhere in-between.
Sure. Let’s consider the price of apartments. Obviously, the best possible price is 0$, and, we may consider than any price higher than 2,000$ is a worst level. A price of 550$ is probably in the middle between these two extreme values. It’s not that good, but it’s not that bad. Now, 450$ is quite better, and 350$ is very very good. On the opposite 1,250$ is quite bad. The following figure shows how we place the different levels on a single scale:
Now, MACBETH will translate your scale of levels into a mapping of levels with values between 0 and 1.
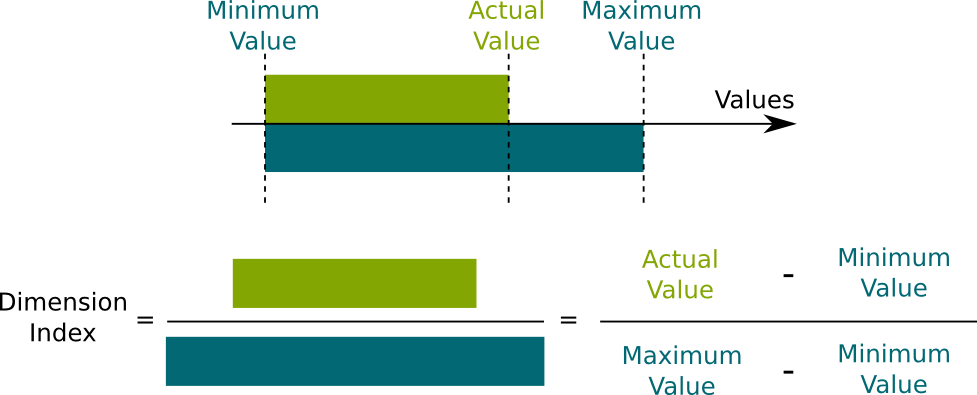
By using the same concept of dimension index as the one used for calculations of Human Development Index for instance:
In this setting, the value of a price of 2,000$ is 0, while the value of a price of 0$ is 1. The value of 550$ is .5, while the value of 450$ is about .7.
Indeed. Because all indices are between 0 and 1, they can be compared and are much easier to interprete. Yet, just because values are computed as indices doesn’t mean that different indices can be compared with each other directly, as we will see later in this article! In my PhD research, I’m actually working on ways of comparing different values corresponding to different criteria, in particular to compare utilities of different agents. Still, MACBETH doesn’t require a direct comparison of indices.
MACBETH will help you. Several years of practice have improved the user-friendliness of MACBETH.
MACBETH will first ask you multiple choice questions like: How much would you prefer paying 450$ rather than 550$, as it will propose answers such as not much, a bit and a lot. Based on a few of these questions, it will generate itself the scale of levels, which you can then modify as you wish.
Yes we are. We now have to determine weights.
Determining Weights
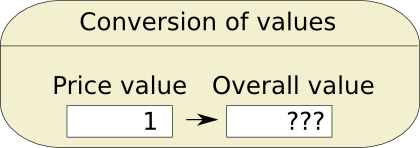
The right way to understand weights is to understand them as a conversion factor. We have to consider that one unit of a value of price is not necessarily the same as one unit of value of location. In order to make this clear, one unit of a value of price will be called one price value, as opposed to one location value, one camera value and one roommate value. The conversion now consists in converting one price value into some overall value. And we have to do the same for location value, camera value and roommate value.
Imagine you wanted to compare 30 miles and 40 kilometers. What would you do?
Well, the idea for finding weights is just almost that. The problem we face though is that answering the question to how many overall values is 1 price value is equivalent to? is impossible. In fact, the very concept of overall value is too abstract for us to give directly a value to it. Instead, MACBETH tries to compare criterion values between each other.
No, that’s not what MACBETH does. MACBETH will actually replace the measures of price and location values by levels corresponding to these values.
That’s much better, isn’t it? But still not good enough. It’s still a hard question because, we are not really comparing two alternatives. We are comparing two levels of two different criteria.
MACBETH will propose two hypothetical alternatives that will be easier for us to compare. These two alternatives will only differ on the levels of the two criteria whose values we want to compare. So the sort of question MACBETH asks is…
Yes, in which case, MACBETH would give you 5 possible answers: Yes a lot, yes, it’s equivalent, no and not at all.
Before telling how the weights are actually computed, let me give you a quick reasoning in the simple case you’d answer it’s equivalent. Keep in mind though that it’s not how things are actually done. Then the price value of 450$ converted into overall value plus the location value of Lionel-Groux converted into overall value, is equal to the price value of 350$ converted into overall value plus the location value of de l’Église converted into overall value. This gives us the following formula:
A little manipulation of the equation gives us the conversion factor between price values and location values:
Now, in this equation, we can replace the values by the ones found earlier. Suppose that, based on the determining value phase, we have established that the price values of 450$ and 350$ are .7 and .8, while the location values of Lionel-Groux and de l’Église are .6 and .4. Then, the above relation implies that 1 price value is equivalent to (.4-.6)/(.7-.8)=2 location value.
Indeed. To be more accurate in this analysis, MACBETH will give you several comparisons like the previous ones, linking every two criteria. More precisely, it starts by considering a “neutral” alternative whose levels of criteria correspond to average values of levels of criteria. In our case, that could be an apartment for 550$, at Lionel-Groux, with pictures OK and undefined roommates. Then, it will consider two sorts of comparisons.
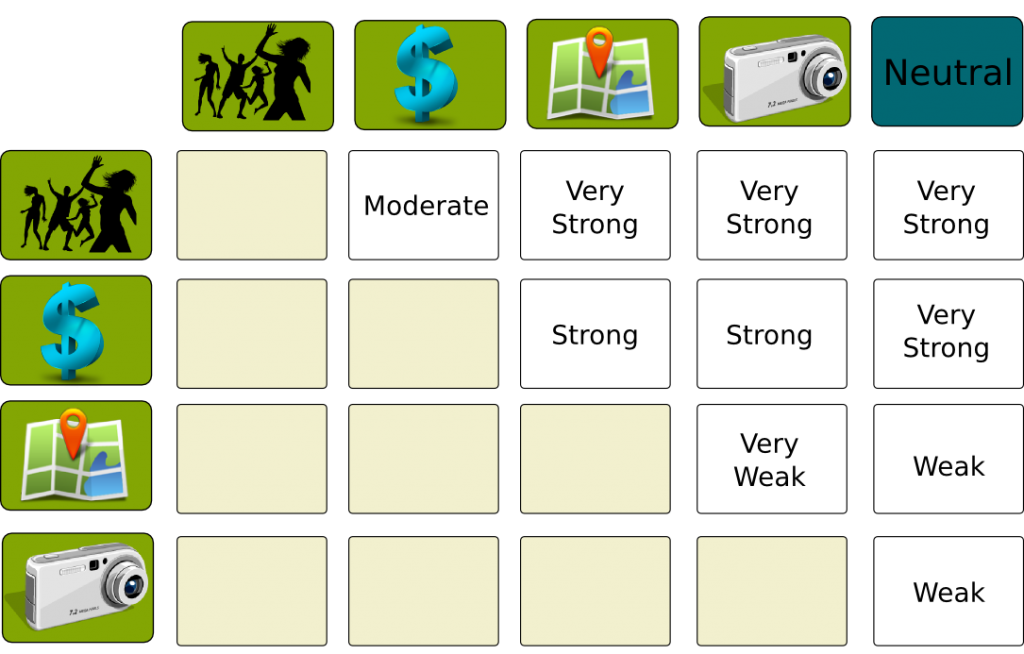
First, for every criterium, it will ask you how much you’d prefer having the best possible improvement on that criterium on the neutral alternative. So in our case, how much more attractive would the apartment be if, instead of costing 550$, it was for free? Or, how much more attractive would the apartment be if, instead of being at Lionel-Groux, it was downtown? Your answers can be: very weak, weak, moderate, strong and very strong.
Second, it will ask you to compare alternatives where two criteria differ as we did before, with modifications to the neutral alternative. For instance, how much more attractive would be an apartment for free at Lionel-Groux compared to an apartment at 550$ downtown? You’ll have the same set of possible answers. Eventually, you’ll be filling an array such as the following, where criteria are ordered given your answers:
Yes there can be. What’s nice is that MACBETH will highlight the inconsistencies and help you correct them.
Now, MACBETH will solve a simple optimization program to find a way to scale the criteria. This program will impose that the bigger is the difference of importance of two criteria, the larger should be the gap between their weights. Eventually this will give us a scale of criteria weights. This scale will enable the comparison of values of different criteria.
Well, the way MACBETH does it is by imposing that the sum of all weights must be equal to 1. This is a very classical way to do. But I’m actually questioning this in my PhD research. More on that in a future article…
Let’s sum up
Multi-criteria decision analysis can then help us to narrow the list of interesting alternatives to a few of them. Yet, you have to keep in mind that this is merely a way of understanding the more complex problem of comparing alternatives. In fact, from what I remember there was no measure of degree of certain of the rightfulness of the ordering of alternatives given by MACBETH. If I’m mistaken, please notice it and correct me!
Still, multi-criteria analysis seems essential to me to deal with complex problems which require the comparison of a great number of possibilities. For instance, when affecting students to schools or militaries to regiments, multi-criteria analysis can enable an ordering of all schools or regiments by everyone in a simple way. Plus, by using multi-criteria analysis, since people will not reduce themselves to a few possibilities they may be less disappointed as they will find out that their affectation globally corresponds to what they were aiming at.







Hi from South Africa,
I’m very interested to know about the part left out of the article.
How does MACBETH work out the final preference vector representing the criteria weights? I am guessing it is similar to finding the eigenvector per Saaty’s AHP method which also compares each criteria to every other criteria? Somehow that comparison ends up quantifying the user’s hidden/unaware preferences from which an eigenvector is used to derive a normalized preference vector (your percentage weights).
What I’m also curious about is how the nominal statements Very Strong, Weak etc translate into numerical attributes.
Thanks, and great work on this site. I really do enjoy the subject matter!
First, thank you. I really appreciate the compliment!
Now, I wrote this article quite a while ago, and I’m very to say that I don’t exactly remember the answer to your questions. I know there was something about using a shortest path algorithm to compute the weights, but I’m so sorry I do not recall the meaning of the graph the shortest path is computed on.
Hi, I am learning about Macbeth, however I haven’t found information to do it by hand, it is impossible? I mean, if I want to do a simple decision tree by hand I know how to do it and how its work, but it is possible calculate the values scale for each criteria by hand or I must need a software to solve it by Macbeth?