In my article on colors, I talked about wavelengths and frequency without explaining what they were. What this article aims at is giving you the understanding of what scientists thought colors were in the end of the 19th century, according to James Maxwell’s electromagnetism theory. In order to do that, I’ll be presenting one of the most fundamental breakthrough of the history of mathematics and physics: the Fourier analysis, introduced by the French mathematician Joseph Fourier in the beginning of the 19th century.
The Fourier analysis explains why we see the colors we see, why we understand when people talk (as long as they make it simple!) and why your computer can access Science4All via the Internet. Applications are numerous in plenty of fields, including number theory, option pricing and protein structure analysis! Shortly put, the Fourier analysis is the mathematical translation of a signal in time and its frequency decomposition.
I guess that, by mentioning several concepts at once, I’ve be sending mixed signals…
Operations on signals
Let’s start by the definition of a signal in time. We need to consider a real number, which can be a physics measure. In the case of sound, this number is the pressure of the air near your ears.
Now, this number can vary through time. In fact, each time is associated with a number. We say that there is a function mapping time with numbers. This function is the signal. In the case of sound, the signal is a function that maps the time with the pressure near the ears (sexy, right?). A usual way to describe such functions is to draw a graph such as the following. On the figure, given any time, we can retrieve the number mapped with this time.
An important feature that signals must have to consider a Fourier analysis is the fact that we can add signals.
When two people talk to you simultaneously, the sound signals they are sending you get added.
The sum of the two signals is obtained by adding the measures of each signal at that time. This is what the following figure displays. Notice that, at the time of measure, the measures of the initial signals are 2 and -1, thus, the measure of the obtained signal at the time of measure is 2+(-1)=1. The final signal is obtained by doing that for all times.
Now, in order to introduce the Fourier analysis, another feature of signals is important.
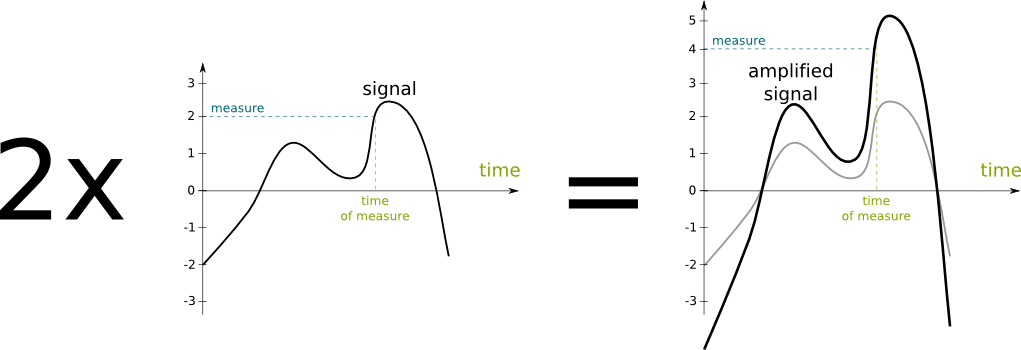
Signal amplification! The amplification of a signal is by obtained by multiplying the measure at each time by the amplification factor. Here is an illustration, where the amplification factor is 2:
The figure only presents the amplification by a constant factor. But a person talking to you may actually be coming to you simultaneously, or he may be walking away from. Thus, the signal he sends would be multiplied by an amplification factor which varies through time. This amplification factor can then be regarded as another signal. In fact, multiplying signals by extremely variable signals is the fundamental principle of radio transmission, and it’s also useful to apply Fourier’s decomposition method. Radio transmission is quite an interesting problem, which includes major theories such as electromagnetism and information theory. I invite those of you who know the topics to write an article on them!
There’s one last operation on signals which is convenient to talk about the Fourier analysis…
Delaying signals. On the figure, delaying simply corresponds to moving the signal horizontally, as displayed below:
We now have all the required features of signals to introduce the Fourier analysis. But we still need to define the basic elements of the Fourier analysis: trigonometric functions!
Trigonometric Functions
Trigonometric functions are the atoms of Fourier’s world. They are the equivalent of prime numbers in number theory: They make up everything. Or rather, everything can be made up with them. This amazing phenomenon means that the understanding of all signals can be done by the mere understanding of these trigonometric functions! How beautiful is this?
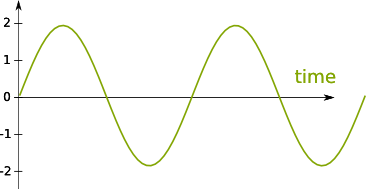
You’re right. Trigonometric functions are the functions commonly known as the sine and cosine functions. More importantly, they represent signals which are extremely regular oscillations. The following figure displays one of these signals (but keep in mind that they go infinitely like this in both directions):
By moving them from left to right and by contracting or dilating the figure like an accordeon, you can obtain all trigonometric functions!
First, let’s notice that the previous figure shows a pattern: If you copy the figure and move the copy to the right by just the right amount, the initial figure and the copy will perfectly match, as displayed in the following figure:
This property is known as periodicity. The movement of the copy is known as a period. In fact, notice that if you move the curve by any number of that period, then there will still be a perfect matching. Thus, there are plenty of periods. The smallest of all periods is the one known as “the” period. It is a measure of time. Now, an equivalent way of talking about the period is to count the number of period there is in 1 second. This is known as the frequency, and its unit is the Hertz. The following simple relation links the frequency and the period:
[math]! frequency\text{ (in Hertz) }= \frac{1}{period\text{ (in seconds)}}[/math]
Modifying the frequency will stretch or dilate the curve. For instance, if we double the frequency, then the period will be divided by two, which means that the curve will be stretched by a factor of 2, as displayed in the following figure:
I’m getting there! Every trigonometric function has a frequency.
Almost. We can still move the curve from left to right, creating different signals. This operation corresponds to the delay operation we mentioned earlier. Now, the phase is directly related to this delay between two trigonometric functions of same frequency. Notice that if we delay a trigonometric function by a certain number of times its period, then the delay operation yields no modification. As a result, adding or subtracting a certain number of periods to the delay yields no modification to a trigonometric function.
We’re done with defining trigonometric functions! Let’s recapitulate: Trigonometric functions are defined by their frequency and phase.
We cannot move trigonometric functions up or down, because they have to be vertically centered on 0. Now, stretching them up or down can be easily done by the multiplication operation by a constant. The basic trigonometric functions are unstretched, that is, their maxima and minima are 1 and -1. But this vertical stretching operation is, as we will see, a crucial operation for Fourier’s decomposition.
Fourier Decomposition
As I said it earlier, these trigonometric functions are the atoms of all signals, according to the Fourier analysis.
I mean that any signal is made of trigonometric functions. More precisely, any signal is the sum of weighted trigonometric functions of different frequencies with certain phases plus a certain constant.
Sorry. I have used several concepts in one sentence… Let’s start by the constant. You may have noticed that a signal is not necessarily vertically centered. Yet, since a trigonometric function is vertically centered, any sum of trigonometric functions is also vertically centered.
We just need to center them vertically first. In order to do that, we simply need to add or subtract a constant to the signal. This constant is the one I was talking about.
This constant is the average measure of the signal. It can be computed with an integral. An integral is a fundamental operation on signals, which is essential to a better understanding of the Fourier analysis but not for the understanding of this article. If you can, please write about integrals…
Let’s see what this gives us on graphically:
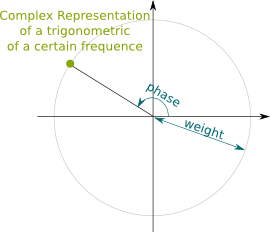
Let’s consider a centered signal. What the Fourier analysis says is that there exists a set of frequencies that compose this signal. Each of these frequencies are associated with a weight (a positive real number that takes care of the vertical stretching) and a phase. This gives us a set of weighted phased trigonometric function.
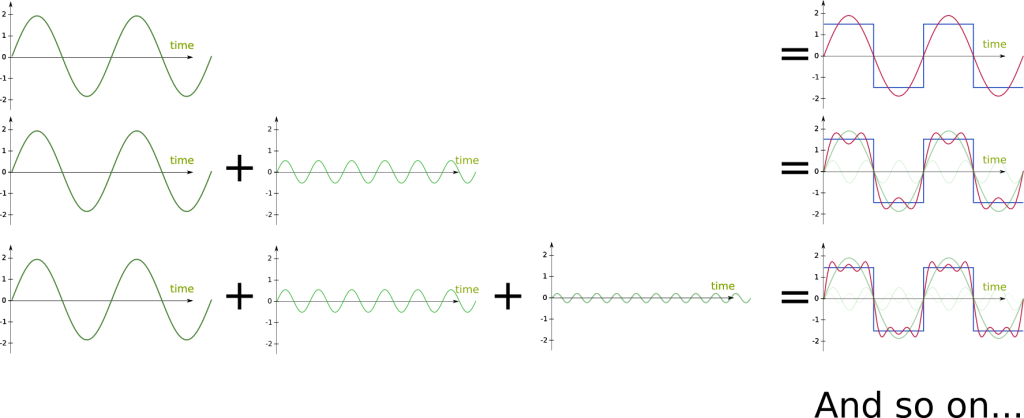
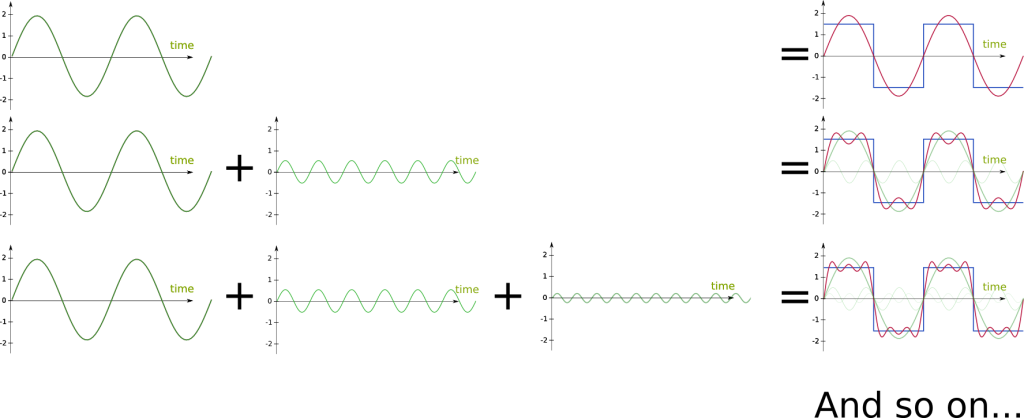
I mean that adding up all the weighted phased trigonometric functions produce the signal! Now, this may be a little tricky to understand as there is usually an infinity of weighted phased trigonometric functions which compose the signal. The following figure displays the Fourier decomposition of the blue square signal into the green weighted phased trigonometric functions. At each stage, we add one green weighted phased trigonometric functions, resulting in the red signal.
An infinity of them!
Not in the general case! But with some right conditions, we will have a convergence of the red signals towards the blue signal.
Indeed. Even after having added all the trigonometric functions, the obtained signal differs. In our case, it will differ at each modification of the measure of the blue square signal. But that’s ok. In fact the set of points on which it will differ is seemingly insignificant compared to the set of points it does not differ. More accurately, the set of points on which it will differ is of measure zero. Don’t expect me to explain this here, it’s way too complicated… But I plan on writing an article on measure theory, so you’ll understand what I mean!
Since the difference is insignificant, we say that the two signals are equivalent.
Indeed. That’s the amazing aftermath of Fourier’s work. We can describe the signal by simply describing the elements of the decomposition. But the case of the blue square signal is actually relatively simple because the signal is periodic. In the more general case, trigonometric functions of all frequencies may be required. For each of them, the weight and the phase need to be defined. For much simpler notations and calculations, these two elements are usually described by a complex number whose absolute value is the weight and whose argument is the phase. Complex-valued signals are in fact the more natural space on which to define Fourier analysis. This aspect is unavoidable for quantum mechanics, as you can read it in my article on the dynamics of the wave function, which provides a better insight into Fourier analysis.
Check this awesome animation on Matthen’s blog to visualize how complex trigonometry induces the Fourier composition.
As a result, in the general case, the Fourier decomposition consists in associating all frequencies with a complex number. This corresponds to describing a function which maps any real number with a complex number. Thus, what the Fourier decomposition really is about is finding this complex-valued function which describes trigonometric functions that compose a function. And Fourier proved that this could be done given a few hypotheses! But that’s not the greatest part…
The Fourier decomposition, that is, this complex-valued function, is unique!
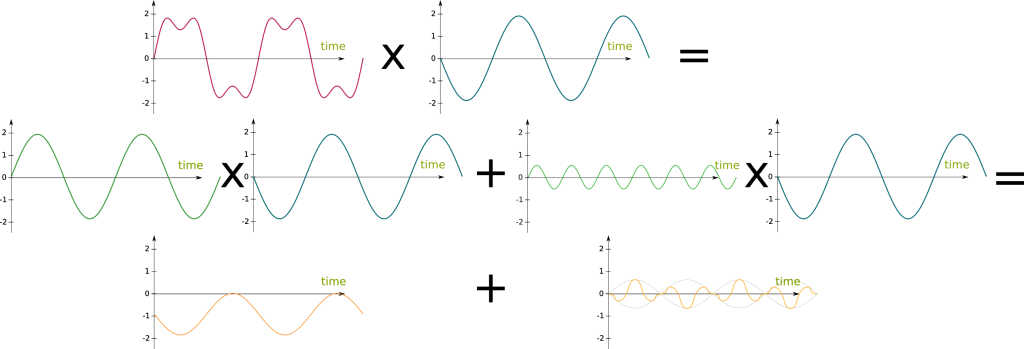
I’m getting there… Finding the Fourier decomposition of a signal is relatively easy! The complex value associated with a frequency [math]\omega[/math] can be obtained by multiplying the signal by a trigonometric function of the opposite frequency [math]-\omega[/math] and taking the integral of the obtained signal! Well, it’d be hard to do on a sheet of paper, but computers can easily carry out this operation!
But it’s not. In fact, given a frequency, the multiplication of a signal by a trigonometric function of the opposite frequency will create a sort of resonance. The trigonometric function of that frequency which compose the signal will be enhanced. The integral will then yield the amplitude and the phase of this trigonometric function. Meanwhile, trigonometric functions of other frequencies which compose the signal will not synchronized with the trigonometric function of the opposite frequency, leading to a centered signal. This is displayed in the following figure, where the red curve is the composition of the two green trigonometric functions:
Since the multiplication of trigonometric functions of non-opposite frequencies is a centered signal, its average is nil. The average of the multiplication of a signal with a trigonometric function of a frequency will therefore yield the information about the trigonometric function of the opposite frequency which compose the signal.
But not the greatest part! The operation to obtain the Fourier decomposition of a signal is almost the same as the operation to produce a signal based on its Fourier decomposition! Indeed, reproducing the signal consists in summing all weighted phased trigonometric functions which compose the signal. The weighted phased trigonometric functions are constructed by multiplying the weights and phases and provided by the Fourier decomposition and the trigonometric functions of all frequencies. We then sum them all by using the integral operator.
The two operations we have mentioned are called the Fourier transform. They are not always allowed: Functions must have some properties, like integrability. The Fourier analysis thus provides a dual understanding of signals, and the translation from the former to the latter is almost the same as the translation from the latter to the former!

But still not the greatest part! The greatest part, well, according to me, is that nature has developed plenty of ways to actually carry out this operation itself. Our ears are equipped with hair cells which provide the Fourier decomposition of the signal of air pressure received by our ears!
Each hair cell actually captures one particular frequency. And since we have a finite number of hair cells, our brain has only a finite Fourier decomposition of a sound. This means that it could not reconstitute a signal. In particular, the brain and the ears are not aware of very high and very low frequencies. This explains why we are only sensitive of sound frequencies between about 20 and 20,000 Hertz.
This remark has led to the MP3 decomposition of sound. As opposed to the WAV format which gives the air pressure at each time (it’s thus a simple signal), MP3 only records the frequencies between 20 and 20,000 Hertz which correspond to the signal. As a result, MP3 actually loses some information, but the sound is identical for our ears. By doing so, it enables better audio compression without any lost in listening quality. JPEG and MPEG-4 are based on similar ideas.
Before concluding, check Marcus du Sautoy’s explanation of how sounds of musical instruments are decomposed by Fourier analysis:
Let’s sum up
The equivalence between signals and their frequencies is a fundamental principle with plenty of applications. Obviously, we have here barely scratched the tip of the iceberg (although I hope it has given you an insight of the form and the size of it!). In fact (this is going to be technical!), the Fourier decomposition is constructed on a more fundamental concept which is the convolution product. Still, it’s a particularly interesting decomposition, as it’s an isomorphism, due to the fact that trigonometric functions form an orthogonal basis of the Hilbert space made of the frequency representations. Those are big words but the ideas, just like the idea of the Fourier decomposition are not that complicated! If you can, please write about those ideas!
Now, the reason why Fourier introduced its analysis was to solve differential equations. In particular, he worked on the heat equation. Indeed, because derivations and integrals of trigonometric functions are very simple, solving the heat equation with sums of trigonometric functions is much easier. There are plenty of other applications in statistics and data analysis. Check Civilized Software Inc. for instance, which produces software for modelings with applications in medicine.
As promised in the introduction, I’ll end this article by mentioning the relationship between Fourier analysis and Maxwell’s equations of electromagnetism. What Maxwell’s equations say is that the space is filled with an electromagnetic field: At each point of space, the electromagnetic field takes a certain value (it’s actually a 6 dimensional value, but let’s assume that it’s just one real number to make things simpler). What’s more, these equations imply that variations of this electromagnetic field at a certain point lead to the propagation of this variation in all directions. The initial variation is the source of light, and the propagation is the movement of light! This is explained in this video from Minute Physics:
Now, our eyes capture the electromagnetic field at the location of our eyes, just like our ears capture the air pressure. The eyes then decompose with a Fourier-like decomposition the electromagnetic signal into three frequencies (it’s actually rather a convolution product). Eventually, it obtains three amplitude corresponding to these three frequencies, hence identifying three colors. Read about my article on colors to learn more.


